Combining Big Data and Crowdsourcing to Build a Smart City
March 21, 2014 — Blog
When people think about smart cities, they usually think about futuristic infrastructures and buildings that automatically adapt to citizens’ needs. Yet I would argue that the most important urban infrastructures are related to mobility, since without it, we wouldn’t be able to move around, goods wouldn’t be delivered, and the city would grind to a halt.
At Snips, we capture and analyze massive amounts of urban data to better understand and predict how people interact with and move around their cities. Eventually, we hope cities will be able adapt to citizens rather than constraining them.
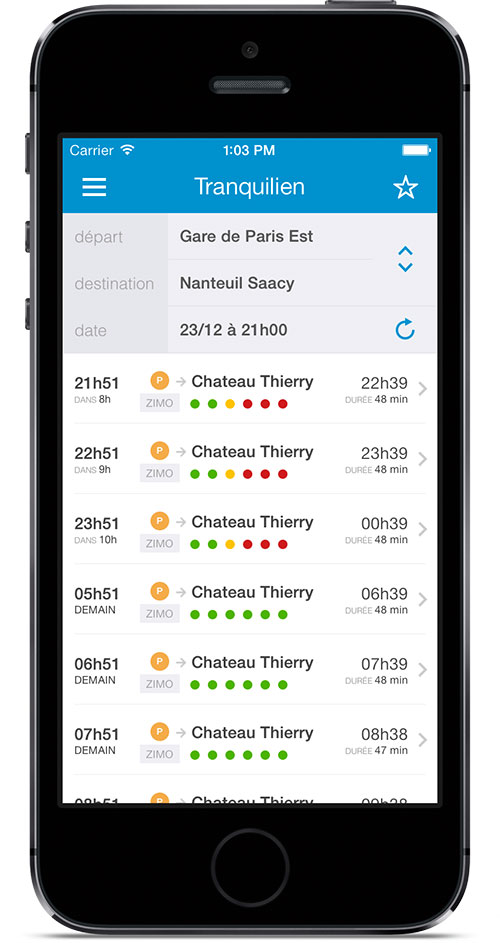
In June 2013, we launched a project in partnership with SNCF, the French national rail operator. We predicted passenger flow in the Parisian regional public transport network, and created an app that helps commuters pick a train where they will be able to find a seat. The app, called Tranquilien, has been a big success so far, with fantastic media attention, a poster campaign in 10,000 Parisian regional trains, and we also won an open data award.
Tranquilien leverages the contextual modeling technology developed at Snips to model urban mobility patterns. From these models, the app predicts how full trains are, up to three days in advance. Since no model is perfect, we invite users to contribute data and let us know how full their train actually is. We take this into consideration in real time to recalculate our predictions. You could say that it’s a union of big data and crowdsourcing!
However, merely providing this kind of information to commuters isn’t enough. We thought it would be really cool to measure and predict multi-modal mobility patterns. After all, if we had a big proportion of commuters using our app, couldn’t we use their mobile phones as anonymous sensors to capture data about many different networks?
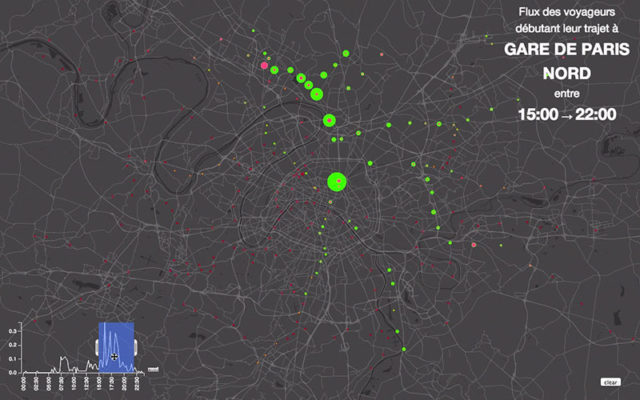
 By combining user contribution with search queries and location signals, we are able to observe origin-destination patterns, as well as where people change train! For example, in the visualization below, we can measure people leaving the Gare du Nord train station in Paris between 3pm and 10pm, and see where they go to.
The concept of using location data to analyze mobility patterns isn’t new. What’s different here is the fact that we can use it to better understand the context and background behind people’s transport behavior. In the example above, we can understand what exactly was happening around each station at the time that the passenger load was measured.
Another example is music concerts: we can use data to suggest alternative modes of transport to people going to the concert venue or going home. We can use it to help the local economy by providing intelligence to restaurants, bars and shops so that they can better serve future customers. Most importantly, it can help us understand how citizens interact with their cities. We’ll soon be able to take a truly user-centric approach to urban planning, by setting up a constant, real-time feedback loop on the effectiveness of new policies.
In short, we need to make smart cities an integral part of connected living, so that we can fulfill the promise of ubiquitous technologies: making life better.