ICT Changes the Ways We Can Deliver Welfare Services
June 4, 2015 — Blog
ICT plays a major role in upgrading urban public services such as public safety, culture and transportation. It makes the services more available and convenient in many aspects.
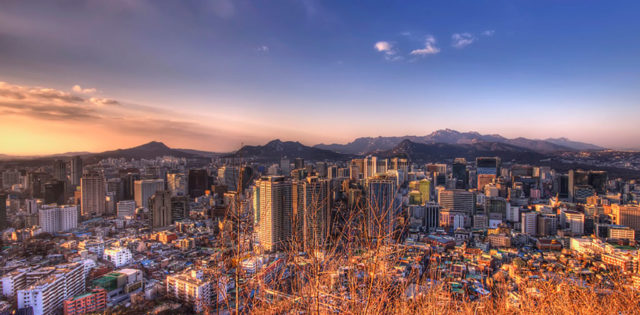
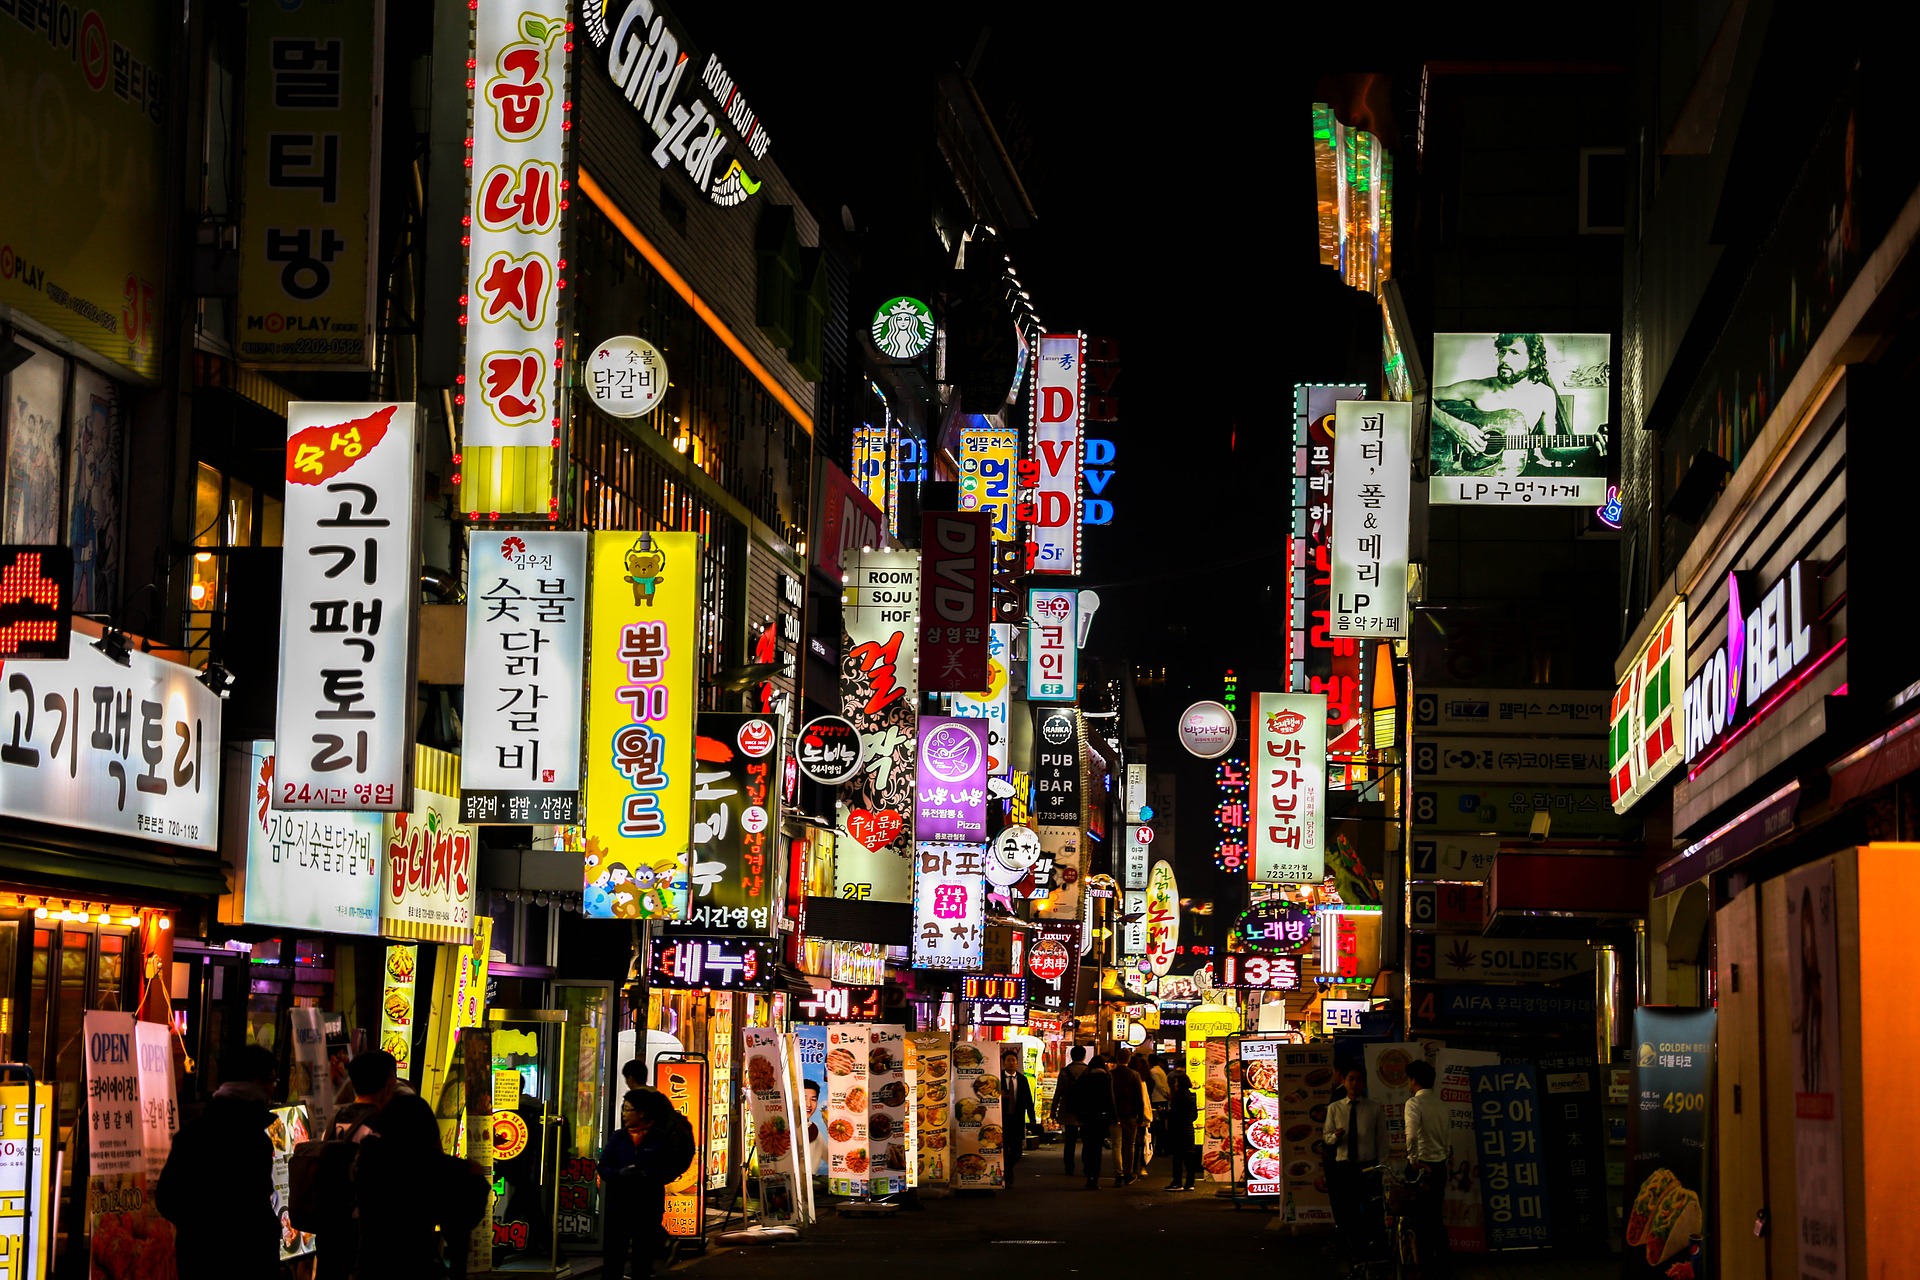
In Seoul, South Korea, many examples illustrate this point. In 2013, Seoul Metropolitan Government (SMG) tried to offer a night bus service for low and medium income people. The night buses could not be operated on a full scale as in normal business hours since the operating cost was so high, even if the demand was quite strong. Big data offered a solution for this matter. SMG analyzed taxi calls at midnight citywide and found some focus areas where many taxi calls were spotted. By using these big data, SMG connected these focus places and created new bus routes. SMG is now operating night buses in eight routes from 12 am to 5 am. The success of this scheme was proven when the night bus (Owl Bus) service was voted as the best public service of the year in 2013 by Seoul citizens. It became a safe guarantee to return home at night at reasonable cost.
The welfare sector is also reaping the benefits of technology. For example, Seodaemun District Seoul applies spatial data mapping to delivery of welfare services. They built community welfare service network by mapping. The welfare map shows not only current welfare recipients but also potential welfare recipients in case some economic crisis happens to them. It also records how regularly welfare workers visit and patrol their sectors in charge. It contains counseling and services that welfare workers provide for people in need. Information on target recipients is comprehensively data-based for easy search and classification. Such a database includes income, housing, living conditions, family relations, welfare needs, and welfare risk level. Each target recipient has his or her welfare risk level marked in color. The high risk group members are marked with red points on the map, the intermediate risk group members with orange points, and low risk group members with blue points. To enhance the accuracy of the survey, supplementary data such as state of employment, utility bill arrears, consumption trend of the households are also used.
The welfare map can be used to reduce welfare blind spots. Those that need public welfare services the most often fail to obtain them, since they do not know how to apply for such services. For example, there was a case in which three sisters in their teens were found neglected in a monthly rental semi-basement room without heating for two years. They suffered from malnutrition, and two of them suffered from mental instability and paraplegia. They did not receive middle school education, which is compulsory in South Korea. Even though they were desperately in need of public welfare services, they could not apply for them.
Seodaemun district Seoul is systematically seeking potential recipients who are desperately in need of welfare services – such as the example above – but get no services. Thus the authorities need to know where they live or stay. Welfare workers are making a complete survey of all areas in their charge to find people in need of welfare services and mark them on the online map. The investigators are constantly updating information of the map, which is shared among related welfare agencies and other welfare workers. Thus welfare recipients can be traced in real time. Various welfare services within a local community are linked to each other by using this welfare map. Welfare services are efficiently delivered to target recipients through volunteers, administrative organizations and welfare associations within a local community.
There are many advantages to changing welfare services from analog to digital. Mapping makes welfare services efficient by tailoring them to specific needs. It also increases local residents’ participation and engagement through information sharing. Some people volunteer to help those in need of welfare services around them.
Mapping is also used in urban management. Cleaning maps and security maps are the cases. A cleaning map can estimate and trace the waste volume produced in focus area of a local community. An intensive management of the area can be made. A security map enables them to strengthen patrol focusing on high crime rate areas, and build preventive urban landscapes, such as lighting enhancement, and wall paintings which can draw people’s attention on the area.
Urban innovation will create various opportunities with technological advances in the future. To make them real is a task for those living in the community.
In Dong Cho will take part in a panel on “Delivering the Promise of Technology” at the New Cities Summit on June 9 -11.