
Liveability Indicators, Local Neighbourhoods, Urban Planning, and Health
October 2, 2020 — The Big Picture
When people think about health and wellbeing, local neighbourhoods are not the first thing that come to mind for many people. However, where people are born, where they live, learn, work, play and age are critical to long term health outcomes. In public health, these factors are referred to as the social determinants of health and they provide shared interest for researchers, designers, developers, urban planners and government policy and planning. The liveability of a place describes the intersection between both urban planning and public health with many of the features in a local environment influenced by planning decisions which in turn influence health and wellbeing of the community. This includes whether people in a neighbourhood can safely walk or ride to local shops and services, have access to public transport, public open space, fresh and affordable healthy food, social infrastructure like schools, childcare, playgrounds, health and social services, arts and culture, sport and recreation services, and have access to affordable and diverse types of housing. How we plan and build our cities has enormous influence on health and wellbeing most recently highlighted by the UN Habitat in their Integrating Health and Territorial Planning Guide. Overall liveability measured at the city level provides useful marketing for promoting a city, but neighbourhood level liveability indicators provide useful evidence to inform planning and improve the liveability of a city by identifying areas of greatest need. Liveable local neighbourhoods support health and wellbeing and reduce health inequities.
In Australia, the liveability of local neighbourhoods, suburbs and municipalities have been measured and mapped in the Australian Urban Observatory at RMIT University launched in 2020. This new digital liveability planning portal provides mapped liveability indicators for Australia’s 21 largest cities which are home to over 70% of the nation’s population. Liveability indicators included in the digital platform have been developed based on over 8 years of existing research linking public health and urban planning evidence to practical applications for citywide decision making, teaching, community engagement and industry. Mapped liveability indicators in the Australian Urban Observatory include: an overall Liveability Index; a Social Infrastructure Index; Walkability; Public Open Space; Transport; Food; Alcohol; Employment; and Housing. Inequities in access to these features are clearly revealed when liveability indicators are viewed at the neighbourhood level. These results translate complex research into easily understood liveability indicators to help guide decision making about where future resources or planning interventions should go, or alternatively, measure and monitor improvements to liveability over time. For example, Walkability of inner local suburbs of Melbourne is provided in Figure 1 below. When local neighbourhoods are aggregated at the suburb level, walkability for local areas appears quite good with only a few suburbs identified with low walkability.
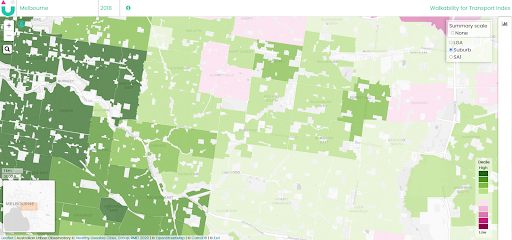
Figure 1: Aggregated suburb level Walkability indicator results for inner Melbourne, Australia (Australian Urban Observatory)
However, when local walkability is measured at the detailed neighbourhood level (similar to Census tract and home to approximately 400 people) then many more areas are identified as being low in walkability (Figure 2).
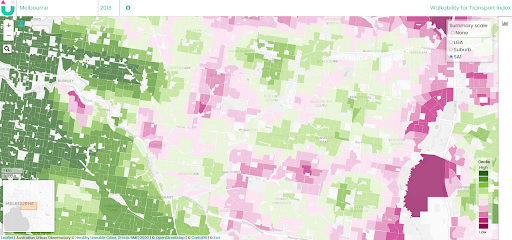
Figure 2: Detailed neighbourhood level Walkability indicator results for inner Melbourne, Australia (Australian Urban Observatory)
The pink shaded areas identified in Figure 2 indicate low levels of walkability and provide clear direction for areas that require future policy and planning intervention to improve walkability for residents living in those areas. This could require review of land use planning, road connectivity or even the density of housing provided in these areas.
Improved walkability is associated with increased walking for transport with direct consequences for improved health particularly as lifestyles become more sedentary, less people achieve physical activity guidelines and obesity rates and cardiovascular disease continue to rise in many countries across world. Increasing walkability in local neighbourhoods is just one example of how research evidence can be communicated using liveability indicators to help build and plan healthier and more liveable places in the city. Walkability and good local transport are also foundations for 30 minute cities planned for Sydney, 20 minute neighbourhoods planned for Melbourne or most recently 15 minute cities planned for Paris. Achieving these targets requires strategic planning for destinations and local services including social infrastructure. In previous research we found that both accessibility and mix of social infrastructure was associated with higher Subjective Wellbeing. This is another great example of how planning and local lived environments influence health and wellbeing.
During the current COVID-19 pandemic nearly 5 million residents of Melbourne have been locked down to a 5km radius for the last 6 weeks across August and September. The lockdown has forced people to live locally and appreciate the liveability of their local areas and public open spaces have never been more appreciated or well used. However, COVID-19 has also emphasized and demonstrated some of the neighbourhood level inequities across cities around the world. Let’s hope that these lessons are not lost in the future. Detailed neighbourhood level evidence needs to inform planning and engage with the community to promote health and wellbeing, reduce health inequities and support sustainable development into the future.
Photo by Kylie Lugo on Unsplash